Google Analytics rolls out Generated Insights feature to decode data fluctuations

Google Analytics introduced a new AI-powered feature called Generated insights that automatically detects and explains significant data fluctuations.
The feature uses natural language to surface trends and anomalies — potentially saving you hours of manual work and so you can react faster to what’s really going on.
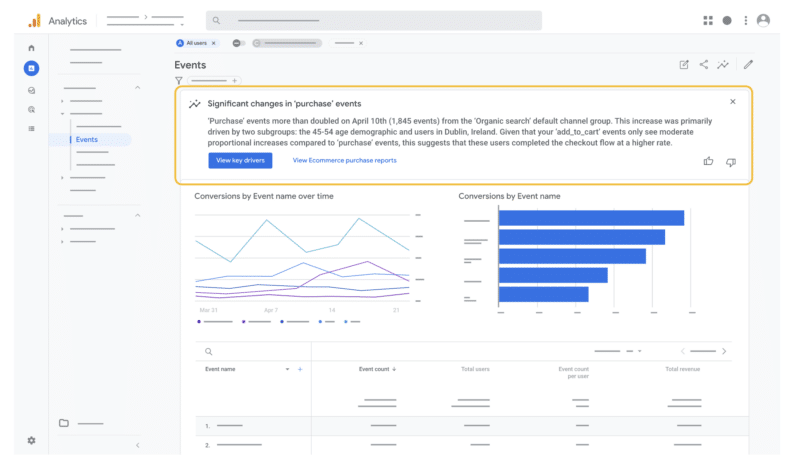
How it works. The Generated insights feature identifies unusual patterns (e.g., unexpected conversion spikes), then analyzes several combinations of dimensions and metrics to determine probable causes. It then delivers explanations in plain language directly within the Analytics interface.
- Generated insights appear natively within detailed reports.
- Explanations are presented conversationally, “almost like a colleague summarizing key takeaways.”
- The system proactively identifies connections between dimensions that might explain data anomalies.

Why we care. Google Analytics’ new Generated Insights feature automatically explains data fluctuations in plain language, saving hours of manual investigation. This means faster campaign adjustments when performance changes, better understanding of what drives results, and the ability for team members without deep analytics expertise to make data-driven decisions.
By immediately understanding why conversion rates spike or drop, advertisers can optimize budgets more effectively and gain a competitive edge through quicker responses to emerging trends.
Between the lines. This automation addresses a common pain point for marketers and analysts who previously spent hours manually investigating data fluctuations across different segments and variables.
The big picture. This move aligns with Google’s broader strategy of embedding generative AI across its product ecosystem, following similar AI-powered features in Google Workspace, Search, and other properties.
What’s next. Users interested in the feature can learn more through Google’s documentation on Generated insights.


